This article introduces a mathematical model that explores how recruitment probabilities translate into long-term workforce composition. The model generates a response surface illustrating how relatively small changes in recruitment probabilities or selection criteria can produce very different outcomes over time.
To illustrate the concept, consider a high-profile professional firm recruiting graduates. Suppose we are interested in the representation of a particular demographic characteristic — for example ethnicity.
The UK population currently includes around 13% people from minority ethnic backgrounds, while analysis of recent graduate statistics suggests that among high-achieving graduates the proportion may be closer to around 24%. (Different assumptions can easily be tested within the model.)
Now imagine that applications are fully anonymised, and the firm selects 100 recruits from a very large pool of applicants.
If the underlying applicant population is approximately 24% from the group being measured, simple probability tells us that the most likely outcome would be around 24 recruits from that group.
Intuitively this makes sense: results close to 24 would be expected to occur more often than results much further away.
What intuition does not immediately reveal is how quickly the probability falls as results move away from the expected value.
Statistically, outcomes such as 14 or 34 recruits from the group — or anything further from the expected value — become increasingly unlikely. In fact, results that differ from the expected proportion by more than around five percentage points are statistically unusual, particularly if such patterns are repeated over several recruitment cycles.
This relationship can be visualised in the Curve of DEIth response surface.
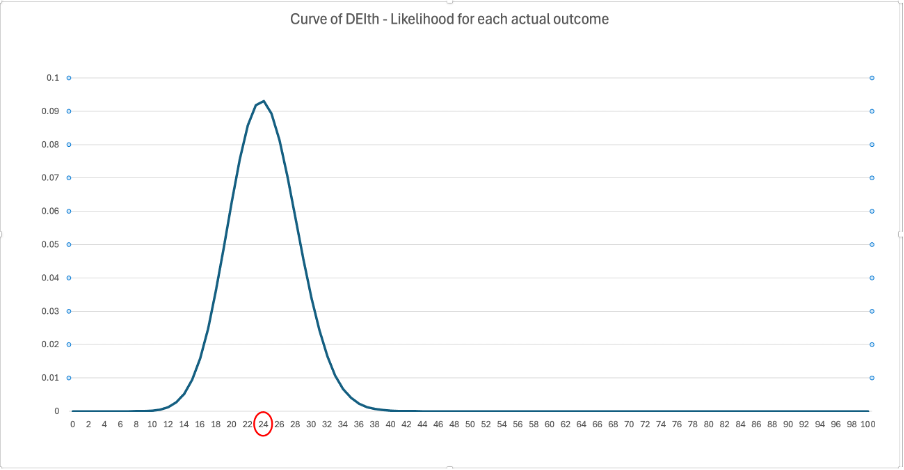
The curve illustrates how recruitment outcomes should normally cluster around the expected proportion when selection processes are operating neutrally with respect to the characteristic being measured.
Why this matters
Understanding the expected statistical variation around recruitment outcomes can help organisations interpret their own data more effectively.
For example, if recruitment results consistently fall far outside the expected range derived from the applicant pool, this may prompt organisations to review factors such as:
- the composition of the applicant pool
- the operation of screening or assessment processes
- recruitment strategy and outreach activities
- possible structural influences within the selection system
The aim of this analysis is not to draw conclusions about any individual organisation, but to provide a quantitative framework for interpreting recruitment outcomes.
Used appropriately, the Curve of DEIth can act as a form of statistical monitoring tool, helping organisations understand whether outcomes appear broadly consistent with the underlying candidate population.
Governance and reporting
Many organisations now publish diversity information voluntarily, and a number of regulators have explored expanded disclosure in this area. As reporting practices develop, organisations may wish to ensure that published figures are supported by robust internal analysis.
Tools such as the Curve of DEIth can assist by helping organisations:
- interpret recruitment statistics in context
- understand expected variation within recruitment outcomes
- assess whether observed results warrant further review
While the model was initially illustrated here using ethnicity data, the same approach can be applied to any characteristic where workforce proportions are being analysed, including gender representation.
Practical use
The Curve of DEIth can be implemented in a straightforward spreadsheet model. Once set up, the tool allows users to input different assumptions about applicant pools and recruitment numbers and immediately observe the statistical implications.
With minimal training, managers and analysts can use the model to explore how recruitment probabilities influence workforce composition and to interpret recruitment outcomes within a clear quantitative framework.
A technical description of the underlying mathematics is provided in the appendix.
Appendix: Mathematical description
Suppose that 100 recruits are selected from a population in which 24% of candidates belong to a particular group.
The probability of recruiting exactly 34 individuals from that group is calculated using the binomial distribution:P(X=34)=(34100)(0.24)34(0.76)66
Where:(34100)=34!(100−34)!100!
To calculate the probability of recruiting 34 or more individuals, the probabilities for all outcomes from 34 up to 100 are summed.
Using this approach:
- Probability of 34 or more recruits from the group: approximately 1.5%
- Probability of 14 or fewer recruits from the group: approximately 1.0%
These probabilities illustrate how recruitment outcomes increasingly diverge from the expected proportion as results move further from the mean.
The distribution is not perfectly symmetric, although in this example it is approximately so.