Recruitment decisions invFactor Q and Recruitment Outcomes
Recruitment decisions rarely depend solely on formal criteria such as academic results or test scores. In practice, organisations often consider a broader set of factors — including interview performance, perceived potential, communication ability, and organisational fit.
These qualitative considerations can influence how candidates are ranked during the final stages of a selection process.
In the Diversity Maths framework, these additional influences are captured through the concept of Factor Q.
Factor Q represents the combined impact of attributes that are not directly reflected in formal academic indicators, but which may nevertheless affect recruitment decisions.
Understanding how Factor Q operates is important when analysing recruitment outcomes and workforce composition.
Modelling recruitment outcomes
To examine these dynamics, we can construct a simple statistical model.
Imagine a recruitment process in which 100 candidates are selected from a large applicant population. We then examine how many of those 100 recruits belong to a particular group — referred to here as a Protected Characteristic (PC).
The model compares two elements:
- the proportion of the characteristic within the applicant population, and
- the distribution of possible recruitment outcomes that might arise if selection were statistically neutral with respect to that characteristic.
When these relationships are plotted graphically, the result is a probability surface showing how likely different outcomes are.
Interpreting the probability curve
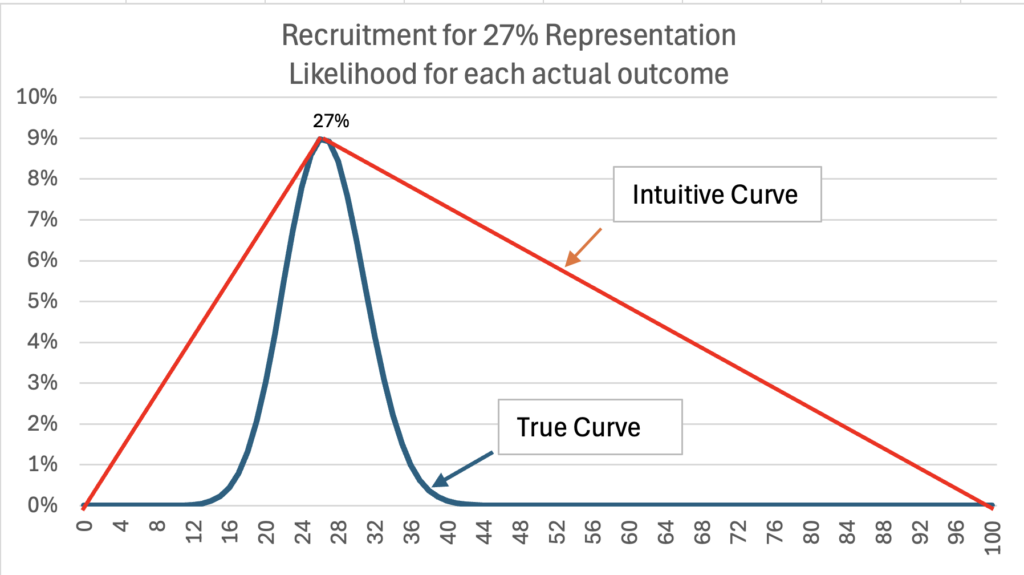
Each point along the horizontal axis represents a possible recruitment outcome — for example, how many of the 100 recruits have the specified characteristic.
The vertical axis shows the probability of observing that outcome, given the composition of the applicant population.
When the characteristic is common within the population — for example around 50% — the curve tends to be relatively wide. A range of outcomes near the expected value may occur with reasonable probability.
However, when the characteristic is relatively rare within the population, the distribution becomes much narrower and more concentrated. In these cases, even small deviations from the expected outcome may become statistically unusual.
In other words, the rarer the characteristic in the applicant population, the tighter the range of plausible recruitment outcomes.
Examples of different population proportions
The Diversity Maths models often examine three illustrative cases:
| Population Share | Example Population |
|---|---|
| 50% | Women in the UK population |
| 27% | Minority ethnic representation among high-achieving graduates |
| 0.5% | Transgender individuals in the UK population |
Each of these populations produces a different probability distribution when modelling recruitment outcomes.
For example:
- When the underlying population share is around 50%, recruitment results may vary noticeably around that level.
- When the share is 27%, the range of likely outcomes becomes narrower.
- When the share is very small, such as 0.5%, only a very limited number of outcomes are statistically plausible.
Understanding these probability patterns helps organisations interpret recruitment data more accurately.
Why this analysis is useful
When recruitment outcomes differ significantly from what would normally be expected given the applicant population, it may indicate that additional factors are influencing candidate selection.
These influences may include legitimate considerations such as interview performance or potential — the types of attributes captured in Factor Q.
By combining statistical modelling with an understanding of recruitment processes, organisations can better interpret the relationship between applicant pools, selection mechanisms and final hiring outcomes.
Next steps
It’s instructive to review the three specific probability “slices” corresponding to the population proportions described above — 50%, 27% and 0.5% — and show how the expected range of recruitment outcomes differs in each case.
These examples illustrate how the Diversity Maths models help translate recruitment statistics into clear, interpretable evidence.