Employment Tribunal cases frequently involve arguments about recruitment or promotion statistics. claimant may argue that an observed outcome – for example, a particular demographic pattern among successful candidates is unlikely to have arisen without discriminatory decision-making. Conversely, respondents may argue that the outcome simply reflects the composition of the applicant pool or normal statistical variation.
Determining which interpretation is more plausible requires quantitative analysis. By modelling the relationship between the applicant population, the selection process and the recruitment outcome, it is possible to estimate the probability of observing particular results under different assumptions. Such analysis cannot determine the legal outcome of a case, but it can assist tribunals and legal representatives in interpreting recruitment statistics more rigorously. The analytical framework described here has been implemented in the Diversity Maths Modelling Toolkit.
There are four useful tools in this area:
1 Recruitment Probability Curve
If a particular group represents approximately 27% of the relevant recruitment population (for example, among graduates achieving first or upper-second degrees), recruitment outcomes might normally be expected to cluster around that proportion, subject to variation arising from the selection process and other factors.
Probability modelling allows the expected range of outcomes to be calculated. Assuming that recruitment is totally anonymised for factors other than degree, which avoids any unconscious bias, the likelihood of various results is shown below:
NB, In practice, recruitment outcomes may differ from the underlying population proportion for a variety of reasons, including selection criteria, interview performance, or organisational priorities.
s.
It can be seen from the horizontal axis and the blue line that results outside the range 16 – 38 are unlikely. However, many people would assume that reality is the red line, ie, that large (or small) figures are realistic, unless other factors are substantially in play.
One interesting factor is that the smaller the representation, the smaller the range of likely outcomes, which will make it harder to conform to “Mansfield Rule” advances.
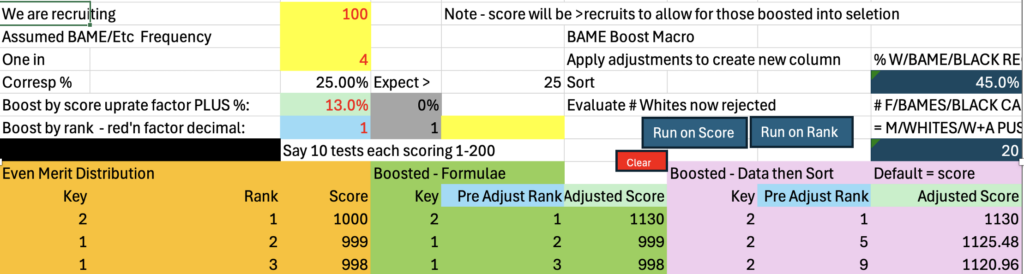
2 Selection Mechanisms and Recruitment Outcomes – Factor Q
Factor Q represents the influence of attributes not captured by academic scores — such as interview performance, perceived potential or organisational fit — which may alter the ranking of candidates once formal thresholds have been passed.
If we now assume an even distribution of merit over race (so, in the above example, any talent band replicates the total population), we can isolate the effect of Factor Q. Awarding a notional number of points to each individual (say 1 – 1,000) allows us to rank the population, and assume every nth individual is in our category (for our BAME example, we can use 25% as an approximation for 27%, which is one in four). So if, for example, we have recruitment of 45%, what is the effect of Factor Q?
An obvious way to do this is to apply a multiplier to the marks obtained by each BAME individual, then see what multiplier delivers the required result. For the above example, the boost (Factor Q) required is 13%, as the illustration below shows:
3 The Stubborn States Framework – Why Workforce Composition Changes Slowly
These programmes examine targets set for the total workforce (eg, raise female representation from 35% to 50%), or a subset (eg, the partnership). Here we set assumptions for recruitment and exit/promotion rates for each group and feeder group. Calculations can be deterministic (ie, one set of assumptions), or stochastic (running on many assumption setts, possibly up to a million runs), and seeing what is required in order to achieve those targets.
For any group, the ONLY sources of change are volumes and shares of recruits and movers – and the constitution of feeder groups is essential in assessing the feasibility of published or even internal targets.
This can be approached in two ways:
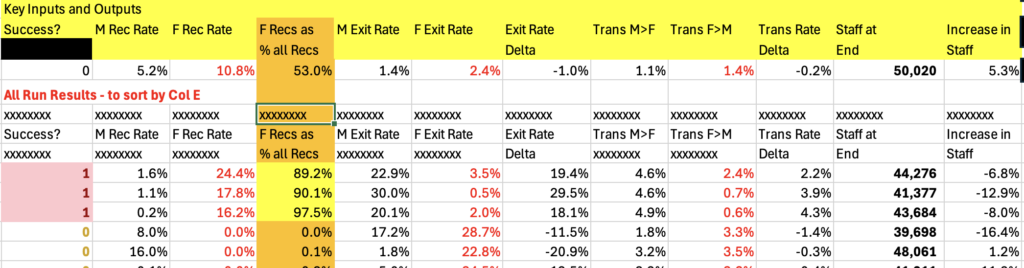
- Single group – a Recruitment Flow Model. Assume our feeder group is stable and consider the behaviour of our main group. For example, consider progress of the partnership just looking at principal promotions, and
- Multistate – a Promotion Flow Model. This considers the changeability of all support groups. This could be appropriate if assessing the effect of graduate recruitment mix in changing the partnership.
The diagram below give a sample of type a) run results.
Real Life Examples
The Furlong decision https://tinyurl.com/4vyb9528
In Furlong v Chief Constable of Cheshire Police the tribunal considered recruitment practices designed to alter workforce representation. The case illustrates how attempts to adjust representation through recruitment alone may encounter legal and operational difficulties, particularly where the broader workforce dynamics have not been analysed.
The Essop decision https://tinyurl.com/36krvdev
In Essop v Home Office, statistical evidence played an important role in demonstrating the disparate impact of an examination requirement on particular groups of candidates.
The analytical techniques described in this article may also be useful in the preparation or evaluation of statistical evidence in employment litigation. In cases where recruitment or promotion outcomes are disputed, probability modelling can assist legal representatives in assessing whether observed patterns are consistent with the underlying candidate population or whether they would be statistically unusual under neutral selection assumptions. In appropriate cases, such analysis may form part of expert evidence presented to the tribunal.
Summary
Quantitative modelling cannot determine the legality of recruitment decisions, which remains a matter for tribunals.
However, it can provide a structured framework for interpreting recruitment statistics and assessing the plausibility of particular outcomes.
The Diversity Maths framework provides a structured method for performing this type of analysis.
Author
Peter Crowley is the developer of the Diversity Maths analytical framework, which models recruitment outcomes and workforce dynamics using probability-based methods.
His work focuses on the statistical interpretation of recruitment and workforce data in organisational and litigation contexts.